| Part I |
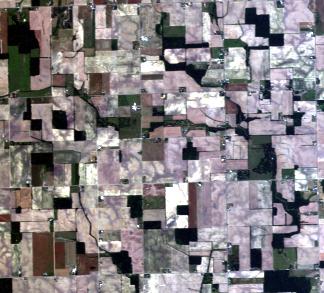
 Here is the spatial subset of the AVIRIS data downloaded to the GIS 6127 folder. Too bad I don't have Windows RAR application on my TA room computer, I could not untar the file. Doing the spatial subset drastically increased ENVI's ability to use the data due to its reduction in size. The bands for the true color image were 10,19,28. The wavelengths were found in the .spc file to be 458.36 nm, 546.96 nm and 635.82 nm.
|
|
| Part II |
Here is a Chipped image of a portal with a CIR on top of a true color image.

|
|
| Part III |
From about 2.025 to 2.1 um and 2.225 to 2.3 the distribution looks skewed towards higher values. Outside of there it looks rather symetrical.
I did offset the plot and look at it, but I didn't post the screen shot here since that doesn't really make sense when looking at min/max/mean for a single mineral.

|
|
| Bonus |
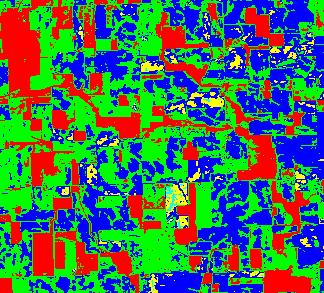
Here is a density slice for the spatially subset image from part I. I used band 19. Here are the classes:
Red: 845-1379
Green: 1380-1914
Blue: 1915-2449
Yellow: 2450-2985
Cyan: 2986-3520
Magenta: 3521-4055
Maroon: 4056-4590
Sea Green: 4591-5126
You will see that the dark areas like green vegetation come out at red on the density slice. Lighter areas that appear white in true color are coming out yellow with maybe a bit of cyan. Green and Blue are representing what looks kind of pink in the true color image.

|
|
|
|
|